|
|
||
Predator-Prey Population graphs Cont'd.
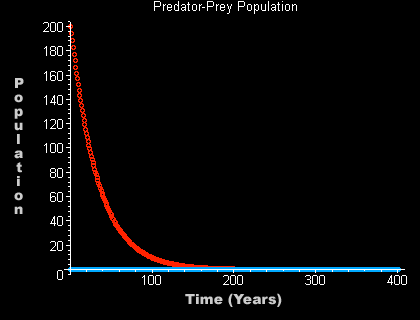
The tragedies of isolation for the predator.This graph spans 400 years and has an initial predator
|

|
|
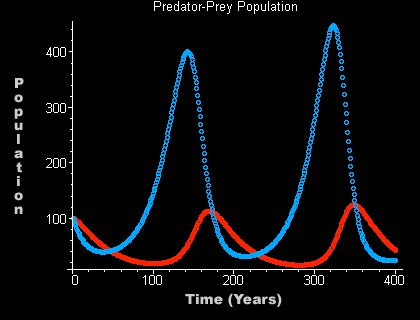
Equal but not separate.
This graph spans 400 years, has an initial prey and predator population of 100.
P1 = 100 Q1 = 100 n = 400
Isolation may be fun for the prey but it is the interaction between the two that is interesting. Here is what happens when the prey and the population both start at 100. Notice that both species decrease first. Even though the prey reproduce at an incredible rate, they are being consumed at a faster rate. The predators are consuming, but they reproduce at such a low rate that their population is also decreasing. After about 30 years there are few enough predators that the rate that they are being consumed is lower. So they began to flourish. The predators do not recover as quickly. It takes them another 100 years before they are able to grow and make use of the prey running around. This becomes a cycle. The predators consume and grow and as expected the prey decrease, then overtime the prey
recuperate, the predators recuperate, and again, the predators consume and grow causing the prey to decrease in size
|
|
Intro Pred-Prey Graphs Phase Plots Equilibrium Points Conclusion&Error